Poland, Białystok
...We offer advanced data visualization services using Microsoft Power BI or Looker Studio (ex. Google Data Studio). We transform complex datasets into clear, actionable insights, helping businesses make informed decisions. Our team creates interactive dashboards and reports that provide analytics, ensuring you can track key performance metrics and trends with ease.
Bulgaria, Sofia
...We design clear infographics that transform complex information into easily digestible visuals. Our process includes creating layouts that combine data, text, and graphics to tell a story or explain a concept. By using engaging visuals, color schemes, and symbols, we ensure that the information is both easy to understand and visually compelling.
Germany, St. Georgen
... data logger, thermocouples, a heat protection container, and application-specific software for visualization, evaluation, logging, and archiving. Measuring temperature range: -196 ºC to 1370 ºC Measuring interval: 0.05 seconds to 10 minutes Accuracy: ±0.2 ºC Resolution: 0.1 ºC Storage capacity: 18,000 measurement values per channel (6 active channels) Start of data collection: Start button, time or temperature trigger Battery: Rechargeable NiMH Thermocouple types: T or K Moisture sensor connection: in the 8-channel system Telemetry: optional...
Austria, Vienna
... Module: Internet Connection: With the Webconnect Data Module, you can connect your inverter or energy management system to the SMA Sunny Portal via the internet. Real-Time Monitoring: Monitor the energy yield, status, and performance of your photovoltaic system in real-time from anywhere. Data Visualization: The SMA Sunny Portal provides a user-friendly platform for visualizing and analyzing your system data. Item Number:SWDM-10...
France, Paris
...Data Analysis: We collect, clean, and analyze your data using advanced tools and techniques to identify trends, patterns, and opportunities for improvement. Reporting and Visualization: We create customized reports and interactive data visualizations to help you visualize and interpret your data clearly and intuitively. Prediction and Modeling: We use statistical modeling and machine learning techniques to forecast future trends and optimize your marketing and business strategies.
Belgium, Anderlecht
......... Innovative design vacuum machine, made entirely of AISI 304 stainless steel Removable sealing bar. Double rigorous sealing of 3.5 mm. Large high-resolution color LCD screen, allowing visualization of all vacuuming stages. Programming directly on the machine's keyboard or from a PC (Memory for 20 specific recipes or products), data transfer via USB port. Vacuum is managed in % or mbar thanks to the...
Germany, Betzigau
...Complete systems for level indication, trend display, data storage, and remote level querying NivoTec® represents technology at UWT that brings levels to where the material planner, plant operator, or supplier needs them. In the production hall, in the office on the PC, on the go on the mobile phone, or at external locations. NivoTec® can be flexibly designed but also offers standardized...
Germany, Nürtingen
... function, previously defined employees are notified of potential disturbances. Big-LinX offers customers a secure investment in the future, as the portal evolves with customer needs. Prepare your company for digitalization. Remote Access: One Click Remote Service Visualization: Dashboard & Dashboard Designer Updates: Firmware Management Administration: User, Rights & Organization Management Notification: Alarm Setup...
Germany, Minden
... industrial vehicles, camera-monitor systems facilitate reverse maneuvers, and navigation devices assist in location detection. In handling systems, screens enable the control and visualization of various processes. Even modern assembly stations often cannot do without the control panel or flat screen.
... efficient communication with LIMS or order processing tools. Number of stacking magazine:5 fixed and 5 automatic stacking magazines max. label width:2“ Resolution:600 dpi max. label diameter:305 mm Possible codes:1D or 2D barcodes, QR codes, data matrix codes or text labels...
Germany, Otterfing
...eddyMOTION is a Windows-based analysis and configuration tool for eddy current probes. In combination with the TX electronics from eddylab GmbH, the software tool combines several performance features: The functional areas oscilloscope, FFT analysis, data logger and waterfall diagram, enables the visualization and documentation of mechanical movements. eddyMOTION also suites the on-site...
Austria, Traun
...Data acquisition module from Secomea with real-time and OEE data visualization, which can be easily set up and managed. IoT cloud service with A1 Digital. Data collection with real-time and OEE data visualization, which can be easily set up and managed on any device (including mobile). This solution is completely secure, sustainable, and offers a transparent pricing model. Simple execution of predictive and preventive maintenance via the cloud from A1 Digital.
Switzerland, Bronschhofen
...The ultrasonic welding process control TSC5 allows for easy integration into automation lines. Together with the cutting-edge software Telso®Flex, you benefit from the most advanced operating software. This enhances your efficiency through clear visualization. All relevant functions, parameters, and results are available via the modern and standardized data interface OPC-UA. You also have full...
Belgium, Fernelmont
...TYPICAL USE Install your monitoring devices anywhere Manage your monitoring device anywhere Access your data from anywhere Alert, report visualization tools FEATURES MONITOR Devices can be located anywhere and connected to the RECOVIB.io platform through a wired Ethernet link or through the mobile wireless network (global coverage). Each MONITOR is factory-configured with a...
Switzerland, Winterthur
Germany, Hamburg
...The WPL-A weighing-labeling system guarantees product quality and food safety. — Intuitive software displays real-time production data along with a dynamic visualization of currently printed labels on a built-in 19-inch Windows touchscreen. — The intuitive label design program in the WPL-A device complies with the latest legal requirements for labeling. It can work with printers in all...
France, Chateaufort
...This highly sophisticated central unit is extremely versatile, offering an economical compromise between a classic central unit and supervision. The screens, designed with simple ergonomics, allow configuration by all users. Expandable up to 30 analog measurement channels. The color touchscreen enables the visualization of a historical curve for each measurement channel. A configurable data...
...The Kuhnke FIO Controller 116 CNC is a PLC based on i.MX6 with integrated CODESYS PLC. In addition to the POUs made available in CODESYS SoftMotion, CODESYS SoftMotion CNC contains POUs for CNC functionality, different kinematic transformations with the appropriate visualization templates and the robotics axis group editor. It is able to exchange data with other systems via industrial Ethernet...
... tools in EdgeWise 5.0 change all that by applying advanced extraction algorithms and automated modeling technologies to accurately extract steel, concrete and wood structure faster than ever before. Plant Modeling Capabilities EdgeWise offers a host of features and tools to bring you from field-to-finish more accurately and much faster than ever before. Automated extraction, spec-driven fitting placement, billion-point visualization, and exacting quality assurance tools all combine to make EdgeWise a true end-to-end modeling solution for process plants.
United Kingdom, Glasgow
...Visualization and quantification of spray nozzle patterns and pressures - A sensitive, waterproof, capacitive tactile sensor array for capturing immediate and actionable spray pattern and spray pressure data generated by sprayed liquids or gases. Capture the spray distribution and impact pressure, and accurately identify the location and pattern where sprayed liquids or gases make contact. Available in two application variants, spray pressure or spray pattern, and optimal for use in situations where spray pressures are extremely low.
Italy, Novate Milanese
... temperature differences more apparent, highlighting areas that are overheated or excessively cold. The images are generated and stored in a thermometric format, meaning that for each pixel, the absolute temperature value is also recorded with exceptional precision to the tenth of a degree. This recorded data is available and can be processed even after storage using dedicated software.
... data integration, visualization and event analysis, and offers users a complete solution of real-time monitoring, detection and traceability. It also analyzes and provides optimal oven dryer profile balance. The detailed wallboard quality maps, the historical temperature trend charts and the images can be seen locally at the operator workstation or remotely. All data is stored in the LogViewer database for complete process visibility and long term traceability. TIP900 System Software Detailed continuous board quality monitoring (100% of all board images are archived)...
France, Lormont-Bordeaux
...providing analysis and visualization tools to accelerate and optimize decision-making through interactive and real-time updated dashboards. The omnipresent data allows for the customization of dashboards to fit the different departments within your company (sales, accounting, and services). This tool promotes collaboration and information sharing within teams, ensuring that all key stakeholders have the necessary information to act effectively.
Switzerland, Niederrohrdorf
...The data acquisition software TranAX 4 transforms your measurement hardware into a comprehensive measurement solution. - Easy programming of channels without any programming knowledge - Data visualization in Multi-Waveform displays - Multiple cursors allow for easy data reading and documentation - X-Y representation - FFT analysis with various scalings and window functions - Measurement data...
...VGraph is the software package for capturing and visualizing data with comprehensive statistical data analysis. It synchronously records up to 16 measurement values – such as thickness, width, and speed of the strip, rolling force, or strip tension – in a production facility, stores them, and performs statistical evaluations. With statistical functions like histograms, Cp and CpK values, and...
... help you find the right type for displaying your data analyses, we support you in this process. From selecting the right tool to designing your reports and, if needed, training your teams. Contact us for an initial, non-binding consultation. Your contact person is happy to assist you: Ursula Flade-Ruf, Tel. 089 589394 12, ursula.fladeruf@mip.de Photo: shutterstock_408277612...
Slovenia, Celje
...Data Visualization (Lean Analytics) allows us to access data on a computer, TV, mobile phone or any other portable device, at any time. Lean analytics (Data visualization) tailored to your needs: With the Power BI analytical tool, we create quick access to automated measurement of indicators and their visual display. Power BI ranks among the top 5 business intelligence tools that support rich...
France, Lyon
... categories and annotations from databases such as Gene Ontology (GO), AltraBio has built its own collection of datasets based on gene expression data available in the literature. Biological interpretation through the use of an integrative approach focused on biological mechanisms. Access to WikiBioPath, a tool that allows interactive visualization of data so that our partners/clients can explore their experimental data and the results of the statistical analysis.
Popular countries for this search term

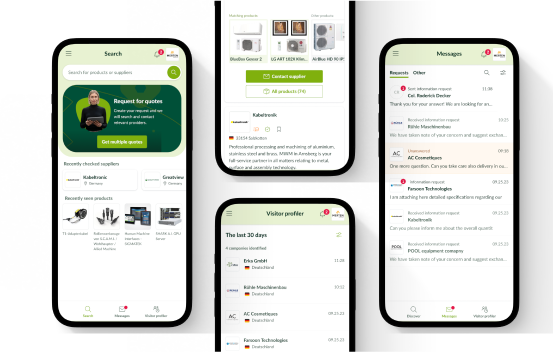
The europages app is here!

Use our improved supplier search or create inquiries on the go with the new europages app.

Download in the App Store

App StoreGoogle Play