

LEAN REŠITVE
Slovenia

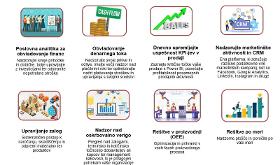
Lean processes: the basis of successful transformation They are the best tool on the path to excellence, achieving lasting progress and adapting business to customer requirements . The practical workshop will present in an interesting and interactive way the views and challenges that companies face in maintaining economic performance and growth . Lean processes are the basis for successful digital transformation Any organization that wants to be successful and leader in its industry in the long run must take care of the best possible use of resources and better cost management . You will be introduced to how development takes place excellent processes in a lean organization , which are a prerequisite for digital transformation . In the implementation of lean manufacturing / logistics and digital transformation employees are key to success. We will present examples of how to connect all stakeholders
LEAN REŠITVE
Slovenia
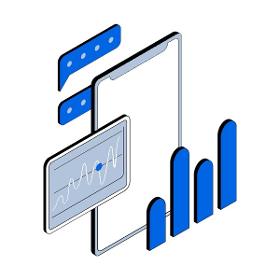
Data Visualization (Lean Analytics) allows us to access data on a computer, TV, mobile phone or any other portable device, at any time. Lean analytics (Data visualization) tailored to your needs: With the Power BI analytical tool, we create quick access to automated measurement of indicators and their visual display. Power BI ranks among the top 5 business intelligence tools that support rich analytical and visualization power to present advanced data design and analytics, such as forecasting future events based on history Lean Analytics Production management z LEAN SOLUTIONS ANALYTICS. On the digital SFM link, you can see an example of an interactive control panel for more efficient management of the production process
EUROVENSYS SP. Z O.O.
Poland
Eurovensys provides comprehensive data analysis services to help businesses unlock valuable insights from their data. We utilize advanced analytical tools and techniques to identify patterns, trends, and opportunities. Our team ensures that your data is structured and analyzed effectively, empowering you to make data-driven decisions and optimize your business processes.
EUROVENSYS SP. Z O.O.
Poland
We offer advanced data visualization services using Microsoft Power BI or Looker Studio (ex. Google Data Studio). We transform complex datasets into clear, actionable insights, helping businesses make informed decisions. Our team creates interactive dashboards and reports that provide analytics, ensuring you can track key performance metrics and trends with ease.
BIZERBA SE & CO. KG
Germany
Gain digital control over your processes with BRAIN2 Dashboard. Simple, clearly structured and flexible. Use the app to create your individual management cockpit. Benefit form intuitive live monitoring. Whenever and wherever you like. BRAIN2 Dashboard offers you best possible transparency about your production. The app visualizes real-time data of your devices or systems on the screen. Clearly arranged, explicit and thematic. The app functions can be selected and operated intuitively.

FLUKE PROCESS INSTRUMENTS GMBH
Germany
The ThermoView TV40 is a high-performance industrial fixed thermal imaging system that allows you to expand your understanding by providing continuous infrared and visual feeds to visualize temperature data. The TV40 offers a fully integrated temperature control, monitoring, and data archiving solution. With the ability to personalize your integration, the TV40 allows you to automate your process by programing unlimited "areas of interest," programable alarms, utilize advanced pass/fail logic, and perform safety or asset inspections. Feed the data to your PLC or view feeds remotely. Hardware The rugged TV40 thermal camera lets you visualize the temperature data you need anywhere in your process with reliable, high-quality 320x240 and 640x480 infrared resolution options. Several key features: IP67 (NEMA 4) housing that guarantees long-term thermal imaging in the harshest environments (air purge and other accessories available) Simultaneous infrared and visible sighting

KENDRION KUHNKE AUTOMATION GMBH
Germany
The Kuhnke Vico 04 series is a powerful indicator with an industrial design for the realisation of modern operating concepts. The installed software package CODESYS HMI makes it possible to visualize data from one or several CDESYS controllers on a remote Kuhnke Vico 04. The visualization is developed either independently or together with the PLC application in the free CODESYS Development System. The Kuhnke Vico 04 series is based on a powerful ARM Cortex-A8 processor combined with a resistive touch display. All components are robust and long-term available.
FLUKE PROCESS INSTRUMENTS GMBH
Germany
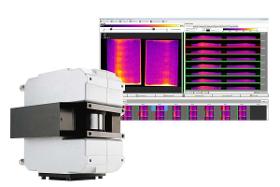
The TIP900 system is a comprehensive thermal imaging and noncontact profiling system designed to supervise the temperature of wallboards coming out of the oven. It uses an infrared thermal imager to continuously scan the entire board surface temperatures and allows the detection in real time of moisture and density variations inside each board. The powerful TIP900 software provides sophisticated data integration, visualization and event analysis, and offers users a complete solution of real-time monitoring, detection and traceability. It also analyzes and provides optimal oven dryer profile balance. The detailed wallboard quality maps, the historical temperature trend charts and the images can be seen locally at the operator workstation or remotely. All data is stored in the LogViewer database for complete process visibility and long term traceability. TIP900 System Software Detailed continuous board quality monitoring (100% of all board images are archived)
EDDYLAB GMBH
Germany
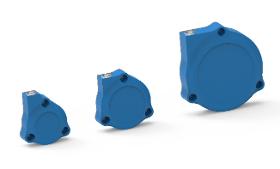
With an extended measuring range up to 45mm, the new eddy current sensor series completes the product portfolio of eddylab GmbH and at the same time combines all advantages of a non-contact eddy current measuring principle: With wear-free distance and displacement measurement, eddy current sensors are characterized by highest precision and dynamics. The new T14/T20/T40 series can withstand extreme temperatures in a range of -40...+150 °C without any problems and is insensitive to external influences such as dirt and dust. The new sensors with measuring ranges between 14 mm and 45 mm are also extremely compact and robust. This makes them ideal for use in difficult industrial environments or vibration measurements with larger amplitudes. Together with the TX electronics from eddylab GmbH and the eddy current software eddyMOTION, measurement data can be analyzed, visualized, and documented.

MINEBEA INTEC GMBH
Germany
The weigh price labeller WPL-A for product quality and food safety — Intuitive software displaying live production data and dynamic visuals of current printed labels on the embedded 19” Windows touch screen. — State-of-the-art weighing and pressure compression technology provide high speeds and innovative options on a compact footprint. — The intuitive label design of the WPL-A follows the latest statutory labelling requirements. Native to all printer configurations, no need for 3rd party software. - Maximum traceability by pack number, product, lot, user and machine ID. ERP connectivity and E-mark software module available.
LEAN REŠITVE
Slovenia
01 Lean Analytics Data Visualization (Lean Analytics) allows us to access data on a computer, TV, mobile phone or any other portable device, at any time. 02 Lean analytics (Data visualization) tailored to your needs: With the Power BI analytical tool, we create quick access to automated measurement of indicators and their visual display. business analytics tailored to your needs Power BI ranks among the top 5 business intelligence tools that support rich analytical and visualization power to present advanced data design and analytics, such as forecasting future events based on history 03 Lean Analytics Production management z LEAN SOLUTIONS ANALYTICS. On the digital SFM link, you can see an example of an interactive control panel for more efficient management of the production process
MICROMEGA DYNAMICS S.A.
Belgium
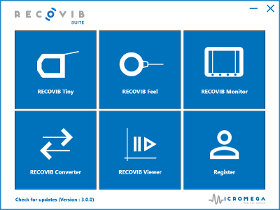
various RECOVIB® devices (Tiny, Feel & Monitor), to visualize recorded data and to convert them to various data formats (txt, wav, MATLAB, LabVIEW, HDF5 etc.). The free Recovib.Suite is composed of 5 application modules The Recovib.Tiny Module allows the user to set up the Recovib.Tiny vibration recorder (i.e. to define the recording period) and to download the recorded data to the host PC. The Recovib.Feel Module allows the user to visualize and record signals acquired with the Recovib.Feel USB vibration sensor connected to the host PC. The Recovib.Monitor Module allows the user to visualize and record signals acquired with Recovib.Monitor acquisition systems connected to the host PC. The Recovib.Converter Module allows the user to export the data recorded by the Recovib devices in various data formats (txt, wav, MATLAB, LabVIEW, HDF5 etc.). The Recovib.Viewer Module allows the user to replay the data recorded by the Recovib devices.
MICROMEGA DYNAMICS S.A.
Belgium
TYPICAL USE Install your monitoring devices anywhere Manage your monitoring device anywhere Access your data from anywhere Alert, report visualization tools FEATURES MONITOR Devices can be located anywhere and connected to the RECOVIB.io platform through a wired Ethernet link or through the mobile wireless network (global coverage). Each MONITOR is factory-configured with a connection key that allows for secured device identification on the recovib.io platform and communication encryption. The MONITOR embedded software automatically takes care of re-transmissions and device re-connections in the event of a poor quality communication link or connection loss to the RECOVIB.IO platform – allowing for a high quality of service even from remote and unattended locations. Monitoring Devices status, connectivity and configuration can be managed remotely making deployment and installation a seamless operation.

MORE BY US LTD.
Bulgaria
We design clear infographics that transform complex information into easily digestible visuals. Our process involves creating layouts that combine data, text, and graphics to effectively tell a story or explain a concept. By using engaging visuals, color schemes, and icons, we ensure that the information is both easy to understand and visually compelling.

MORE BY US LTD.
Bulgaria
Our Social Media Images Design services provide you with custom-designed visuals that enhance your brand’s online presence across all social platforms. We create tailored content that reflects your brand’s identity while meeting the specific requirements and dimensions of each platform. What you get: Custom Graphics for Posts and Stories Branded Templates Social Media Ad Design Profile and Cover Image Design Infographics and Data Visualization Platform-Specific Content Optimization Seasonal and Thematic Visuals Social Media Style Guide
EUROVENSYS SP. Z O.O.
Poland
Eurovensys offers advanced reporting implementation in Power BI to help your business gain actionable insights from the data. We design and implement interactive dashboards and reports that clearly overview key business metrics. Our Power BI solutions enable you to visualize and analyze data effectively, enhancing decision-making and driving performance improvements across your organization.

BRUKER OPTICS GMBH & CO. KG
Germany
The LUMOS II offers outstanding visual and spectral data quality with full automation of all measurement modes: transmission, reflection and ATR. For FTIR beginners and experts alike, the LUMOS II is the best solution for infrared microscopy. Bruker's exclusive Focal Plane Array (FPA) detector technology allows you to experience detailed imaging at the maximum speed. This allows you to take full advantage of the vast possibilities offered by FT-IR microscopy. The OPUS IR software provides you with assistance whenever you need it and allows you to glide effortlessly through measurement, evaluation and reporting. Your advantages: • Extremely fast FT-IR imaging (FPA) • High spectral quality and resolution • Brilliant visual images and huge field of view • Fully automated FT-IR microscope • Integrated, piezo-controlled ATR crystal • Software supported measurement and evaluation • Automatic measurement in transmission, reflection and ATR

Do you sell or make similar products?
Sign up to europages and have your products listed

INFICON AG
Liechtenstein, Principality of
Advanced Modeling, Data Analysis and Visualization Capabilities Made Simple Increase Yield by Expanding Process Data Analysis FabGuard Analysis Server (AS) makes it possible to analyze every variable in the factory to apply advanced multivariate SPC and modeling. Detecting faults caused by the interactions of multiple process variables is accomplished with the many advanced multivariate analysis tools in FabGuard AS. FabGuard Analysis Server can easily expand the capabilities of existing FDC systems by enabling engineers to detect faults not typically monitored by univariate SPC. Many faults are caused by the complex interaction of multiple equipment and process parameters. FabGuard AS provides multiple advanced techniques to perform Fault Detection, Fault Classification and Metrology Prediction. These tools highlight excursions that simple univariate FDC systems will never detect. FabGuard AS provides engineers a powerful toolbox to uncover hard to detect faults.
POWER LOGIC
South Africa
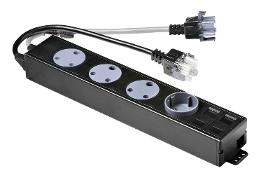
Power Logic SA’s range of Alpha products are as wide and varied as your imagination. The sleek, minimalist styling offers a clean, functional presence with an almost limitless selection of customizable options. Some options include protection modules, timers, data/voice, and audio visual cabling solutions to suit your power distribution needs. This tailored product maximises efficiency and can suit any home or office environment. Besides the single circuit and hybrid units, separate clean power circuits are also available. The Alpha also includes a new swivelling strain relief system to reduce the stress on your cables, and to accommodate multiple mounting options. Alternatively, link multiple units with a bypass cable to create a network of power supply units. *Image used to display the style of the product. This product can accommodate the Schuko, French/Belgium and other international sockets. Contact Power Logic directly for more information.
DRIESEN + KERN GMBH
Germany
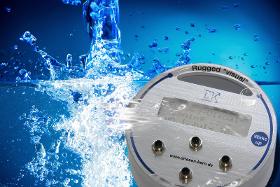
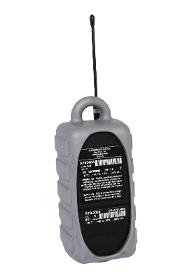
Multi-Channel Data Logger DK650 “rugged-Visual” with Internal and External Sensors The “rugged-Visual” series by Driesen+Kern GmbH sets standards for customizable data acquisition. In addition to ist five integrated sensors for humidity, temperature, barometric pressure, light, and differential pressure the device offers three input slots for external probes or analogue signals. All three slots can be completely configured by the user - hence you don’t need to tie yourself down beforehand, but rather you can customize the “rugged-Visual” according to your measuring task. The robust logger stores up to 4 million readings and its freely selectable sampling interval reaches from 32 Hz to 24 hours. Using modern low power technologies the device can perform continuous operation for up to 4 years with only one standard lithium battery. An internal back up system provides several days of continued logging in case the battery is completely drained. Of course, you can always replace the...
DRIESEN + KERN GMBH
Germany
Multi-Channel Data Logger DK650 “rugged-Visual” with Internal and External Sensors The “rugged-Visual” series by Driesen+Kern GmbH sets standards for customizable data acquisition. In addition to ist five integrated sensors for humidity, temperature, barometric pressure, light, and differential pressure the device offers three input slots for external probes or analogue signals. All three slots can be completely configured by the user - hence you don’t need to tie yourself down beforehand, but rather you can customize the “rugged-Visual” according to your measuring task. The robust logger stores up to 4 million readings and its freely selectable sampling interval reaches from 32 Hz to 24 hours. Using modern low power technologies the device can perform continuous operation for up to 4 years with only one standard lithium battery. An internal back up system provides several days of continued logging in case the battery is completely drained. Of course, you can always replace the...
INOEX GMBH
Germany
The iNOEX Data Manager (iDM) comprises a central data logger for the collection of all process and quality data of the iNOEX systems in the extrusion line. Optimization potentials can be identified, and product-specific key figures can be analyzed and evaluated. The software is installed as a virtual machine in the customer's network, so that no additional hardware is required. OPC-UA as a standardized process data interface, integrated with the latest measurement, control and automation solutions from iNOEX, transfers the data. A connection of legacy systems via the iDM gateway is also possible. By using the Grafana software, iDM 4.0 allows graphs, visualizations and data analysis, data export as .csv or .xls, live data on the database server, use as a hall monitor, as well as ready-made and freely configurable dashboards and reports for each connected system.

BAUMAN MSTU TRANSLATIONS CENTER OF SCIENTIFIC AND BUSINESS PAPERS
Russia
Desktop publishing (DTP) technology allows to combine text, numerical data, photographs, charts, and other visual elements in a document that can be printed on a laser printer or more advanced typesetting machine. It makes possible to self-publish a wide variety of content, from menus to magazines to books, without the expense of commercial printing. We strive for perfection of Professionalism and Quality since 1992. Multilevel control over the quality of translation. Our business process management provides for step-by-step multilevel filtration of the project materials. It ensures the highest quality of translations.
FRIEDRICH VOLLMER FEINMESSGERÄTEBAU GMBH
Germany
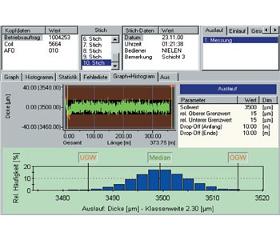
VGraph is the software package for the recording and visualisation of data with extensive statistical data evaluation options. It synchronously records up to 16 measurement values – for example thickness, width and speed of the strip, rolling force or strip tension – on a production line, stores them and evaluates them statistically. With statistical functions such as histograms, Cp and CpK values and error lists, VGraph provides valuable decision aids for the evaluation and further use of the coil produced. The diagnostic instruments allow optimisation of the rolling process and the line engineering. The optional FFT analysis detects periodic fluctuations in the strip thickness. VGraph meets the needs of day-to-day strip production. One example: Random lengths of strip at the leading and trailing ends (drop-off) can be suppressed – even subsequently – in the statistical evaluations.

FRIEDRICH VOLLMER FEINMESSGERÄTEBAU GMBH
Germany
In addition to the strip speed, VRecoS also records up to three further tracks, such as the rolling force or the strip thickness at the ingoing and outgoing ends of the mill. The measurement protocols can be stored, printed out and distributed by e-mail. The measured values are recorded as a function of length. The recording frequency can be set with a scanning rate of 2 ms. Random lengths of strip at the leading and trailing ends (drop-off) can be suppressed, even subsequently. The signals are recorded using a data collector belonging to the scope of supply. Its electronics with input and output modules is designed for installation in switch cabinets or desks in interference-proof 24 Volt top-hat (DIN) rail technology. It transmits the data via a network cable to the Windows recording computer which can be supplied by Vollmer or by the customer.
BLUESENS GAS SENSOR GMBH
Germany
BlueVis: Unified Bioprocess Management. With BlueVis software bioprocesses can be monitored and controlled in an easy way. Sensors and probes can be connected independently from brand. All data will be logged and visualized in real-time. BlueVis processes the data and automatically calculates key parameters (like OUR, CTR, RQ etc.) via integrated soft sensors. Actuators like pumps, stirrers, cryostates or thermostats can be operated and controlled to optimize the process. The software offers all data to process lead systems via integrated OPC server. This way BlueVis is open in both directions. BlueVis is fair and professional solution for all paramteres and applications in bioprocessing. BlueVis: one solution for all parameters and applications.

EASTNETS
Belgium
THE CHALLENGES International regulatory pressures to combat money laundering and terrorist financing have intensified at an unprecedented rate. Due to the nature of financial services, detecting and preventing financial crime is becoming more and more complex. Compliance professionals are thus looking for better and more cost-effective strategies. With a customer-centric focus, EastNets has developed solutions to address these specific challenges. THE SOLUTION en.SafeWatch Profiling® is a rapidly deployable anti-money laundering solution with central data processing, trend analysis and suspicious behavior identification engine that provides a robust, effective and easy-to-use transaction and customer monitoring solution that is configurable and flexible to adapt to new risks and regulations. en.SafeWatch Profiling® is unique in its powerful data analytics and visualization capability, powered by IBM en.
DIGITAL SURF
France
all-in-one surface imaging, analysis and metrology software superset for all types of surface imaging and measuring instrument Top of the line surface imaging, analysis and metrology software MountainsMap® Premium software is a superset of all other MountainsMap® products. It is ready to use with the widest range of surface imaging, analysis and metrology instruments. Advanced features included The most powerful solution for surface imaging, analysis and metrology, MountainsMap® Premium includes all of the advanced surface analysis features that are available in optional modules for other MountainsMap® products. The only optional modules are for highly specialized applications. All of the latest standards & methods Working in MountainsMap® Premium's smart desktop publishing environment it is easy to turn your surface data into detailed visual surface analysis reports in accordance with all of the latest standards and methods.
FLOW-TRONIC
Belgium
The RTQ-2000 is a revolutionary device connecting directly to the Open Channel Non-Contact RAVEN-EYE Radar Velocity flow sensor. The RTQ-2000 has the capacity of transmitting the flow data, raw level, velocity, temperature from most manholes without special manhole cover into the Internet using GPRS data communication technology. Data is available for visualization and download in Excel format from any Internet browser. SMS (option) and E-mail alarming are possible. Automatic Data transfer to an existing data base is possible using XPATH module. Key Features: GPRS Data Transmission directly from the manhole to the 123flow.com platform The 123flow.com platform allows to view the data, build personalized graphics and manage all measurement locations Remote firmware update Remote measuring site configuration Li-Ion rechargeable batteries It transmits the data from most manholes without modifying the manhole cover
Results for
Data visualization - Import exportNumber of results
33 ProductsCountries
Category
- Data analysis (4)
- Business intelligence (3)
- Software (3)
- Information systems - advice (2)
- Infrared tubes (2)
- Programming and software (2)
- Scientific and technical monitoring (2)
- Software creation and development (2)
- Software for industry (2)
- Design and production of advertising campaigns (1)
- Desktop publishing, DTP - software (1)
- ELECTRIC EQUIPMENT (1)
- Food packaging (1)
- Graphic design and production (1)
- Laboratory equipment and instruments (1)
- Measurement - Equipment & Instruments (1)
- Medical Equipment (1)
- Medical and surgical instruments (1)
- Printing (1)
- Sensors (1)