Display & data logger - OS 331

Description
The display & data logger OS 331 is a powerful yet cost-effective local display, sensor interface and data logging solution for virtually any application. Up to 16 sensors can be connected to a single device allowing local nodes to be set up throughout the factory. With it’s easy to use, high resolution 5” touch screen, information from all the connected sensors can be accessed locally making readings easy to access for those on the ground. Modbus/RTU or Modbus TCP output data can be transmitted into the site’s ethernet network allowing information to be viewed in real-time. The display & data logger OS 331 also enables IoT settings to connect with OS4A software IoT version. Alternately locally logged data can be downloaded onto a USB memory card or directly to a computer through the USB port.
- Display boards and screens, electronic
- Display & data logger
Product characteristics
- Display size
- 5"
- Ambient temperature
- 50 °C
Similar products
SCHWEIZER GMBH & CO. KG
Germany

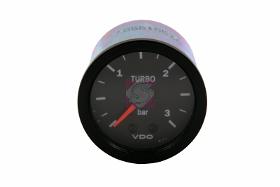
Tank gauges, oil pressure gauges, oil temperature gauges, boost pressure gauges, ammeters and voltmeters for additional installation. All items are from wellknown manufacturers in the field of display instruments
LUTZ PUMPEN GMBH
Germany
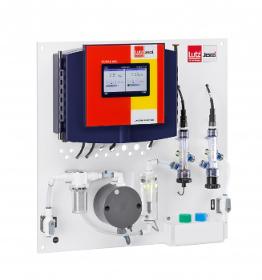
With the EASYPRO CS, you get a configurable system. This customised solution is ideal for industrial applications and saves costs as only the required components are installed. The design of the base plate allows the CS120 to be used in combination with up to three other measured variables in the water. The integrated TOPAX® MC multi-channel controller continuously measures the water parameters and keeps them within the target range. It controls a large number of actuators and final control elements and is simple and intuitive to operate. Components of the EASYPRO CS (mounted on base plate): . Multi-channel controller TOPAX® MC . Measuring cells and measuring cell fittings . Sample water filter . Flow monitor . DFR 45 flow controller with temperature sensor and sample water tapping point . Inlet and outlet tap . Holder for buffer solutions and buffer solutions for adjusting the measuring cells . Multicoloured LEDs

SCHNIEWINDT GMBH & CO. KG
Germany
The CSN® SV Viewer (Sampled Values) is our solution for visualizing and recording the digital IEC 6185092 LE Protocol. This software allows the user to visualize the current and voltage values of different Merging Units. The function Values displays the eight current and voltage values. Additionally it is possible to display a DC offset. In realtime mode, a selectable value is shown continuously. The function Phasor calculates the phase shift between the sampled values channels. The function Waveforms charts the sample values of different Merging Units. The user can add or remove the desired sample values. The waveform can be saved as a screenshot or can be printed by the integrated print function. The function Recorder allows the user to record up to two data streams on the hard drive either as .txtfile, Microsoft Excel Spreadsheet or in COMTRADE format. The .txt files can normally be handled by any spreadsheetsoftware; no special analysis software is required.

Request for quotes
Create one request and get multiple quotes form verified suppliers.
- Only relevant suppliers
- Data privacy compliant
- 100% free